INTUIT ENTERPRISE SUITE · FORRESTER TEI · FY25
Turning a new platform’s value into credible proof—and a GTM system Sales and Marketing could use.
Led the Forrester Total Economic Impact™ study and integrated go-to-market activation for Intuit Enterprise Suite, translating customer outcomes into validated value claims, demand-generation content, seller tools, and measurable pipeline activity.
The Total Economic Impact™ of Intuit Enterprise Suite
Third-party validation of efficiency, cost savings, cash flow, and decision-making impact.
THE CHALLENGE
A promising new platform needed proof customers could believe.
Intuit Enterprise Suite was new, complex, and still building market credibility. The challenge was not simply to explain features—it was to show measurable business value in a way that could stand up to customer scrutiny, legal review, and enterprise buying conversations.
The campaign centered on two tensions: perceived lack of validation and uncertainty around tangible ROI. The strategy was to combine third-party evidence from Forrester with authentic customer outcomes, then make those proof points usable across the funnel.
THE STRATEGY
Build one evidence base, then activate it everywhere.
Validate the value
Partnered across Product, Finance, Research, Analytics, Legal and Forrester to quantify customer benefits and build defensible claims.
Turn evidence into messaging
Organized claims around recovered revenue, reporting efficiency, intercompany transactions, technology savings, invoicing, payroll and better decision making.
Create a content ecosystem
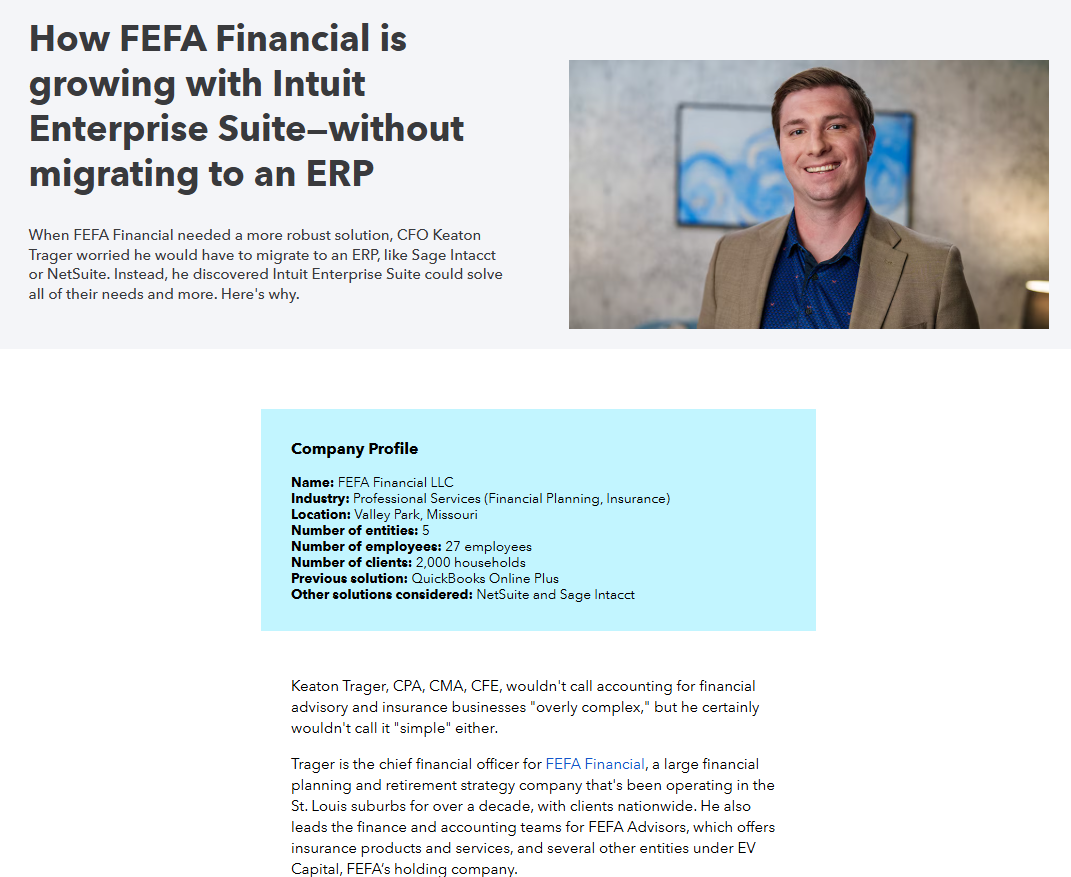
Extended the study into a landing page, webinar, infographic, ROI calculator, blog content, customer quotes and seller-facing materials.
Operationalize through Sales
Built training, talk tracks, cadences, Seismic assets and customer-facing materials so proof could be used in real sales conversations.
WEB EXPERIENCE
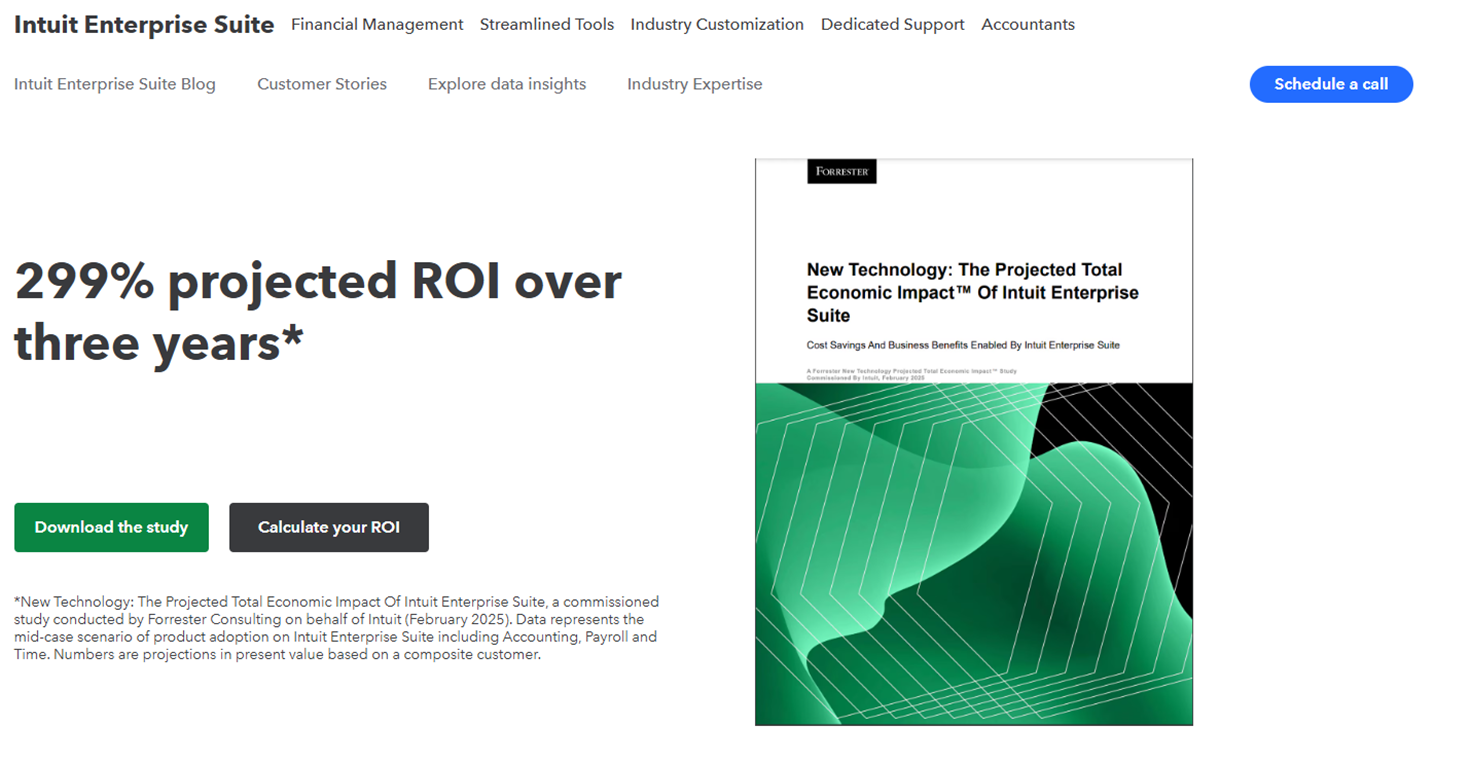
From a gated report to a multi-format proof hub.
ROI TOOL
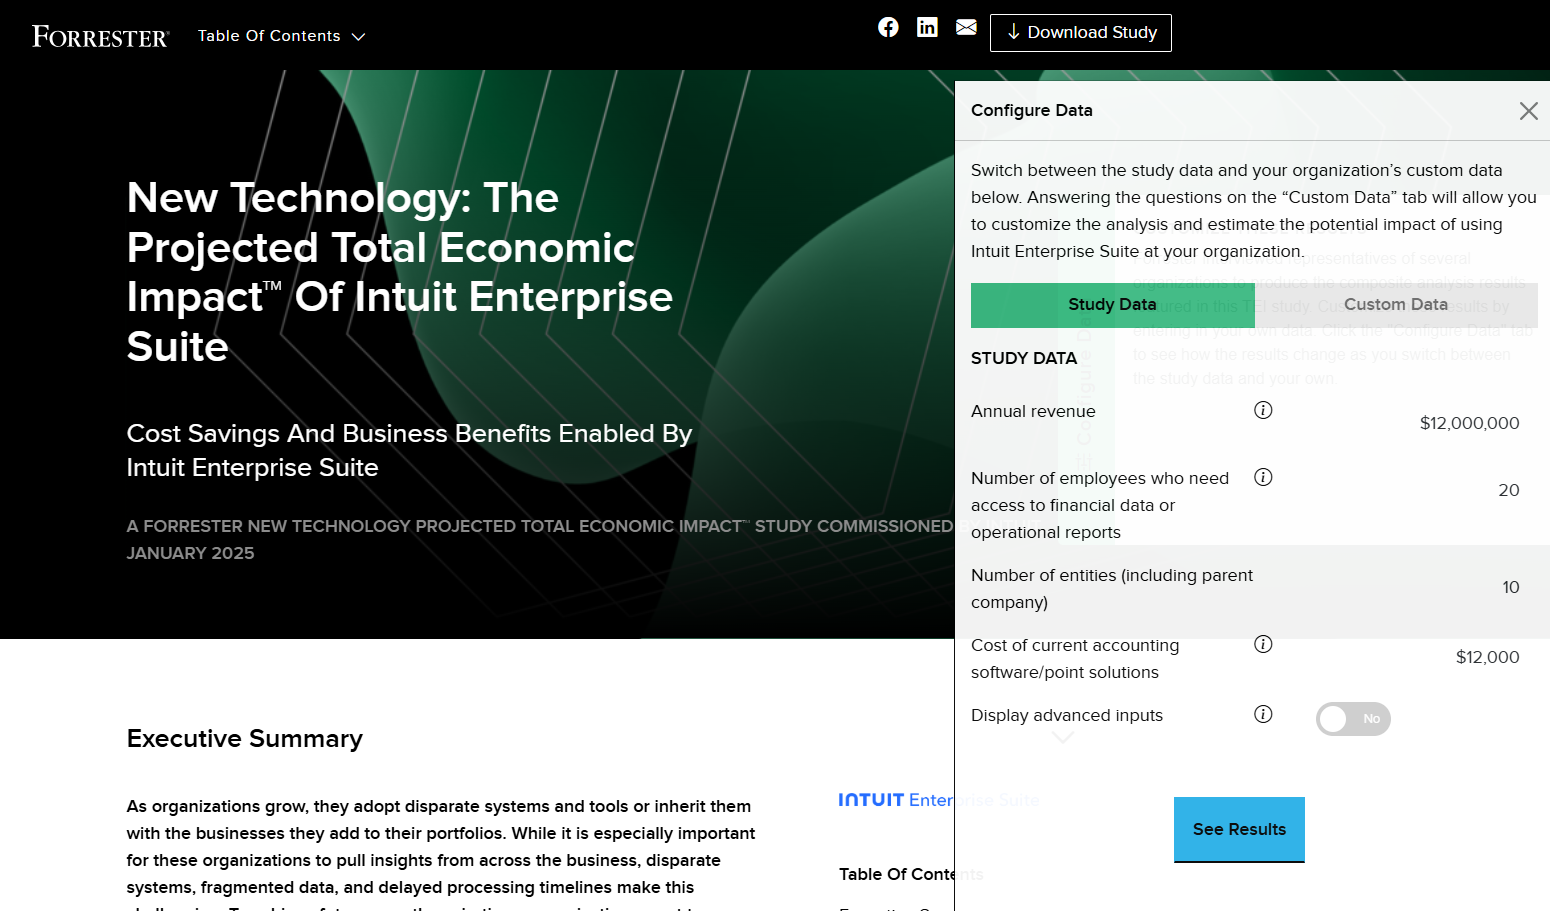
Make the study personal.
The Forrester-hosted digital TEI calculator let prospects configure assumptions and explore their own potential ROI rather than consume a static proof point. Adoption was lower than desired, which became an important learning for FY26: sellers needed clearer training on when and how to incorporate the calculator into their pitch.
INTEGRATED ACTIVATION
The campaign showed up across the customer journey.
Landing page, study, gated flow, calculator
Training, sell sheets, pitch decks, cadences
Forrester webinar and customer storytelling
Blog, infographic, customer proof points
Organic, boosted and paid amplification
IES landing-page experience and lead capture
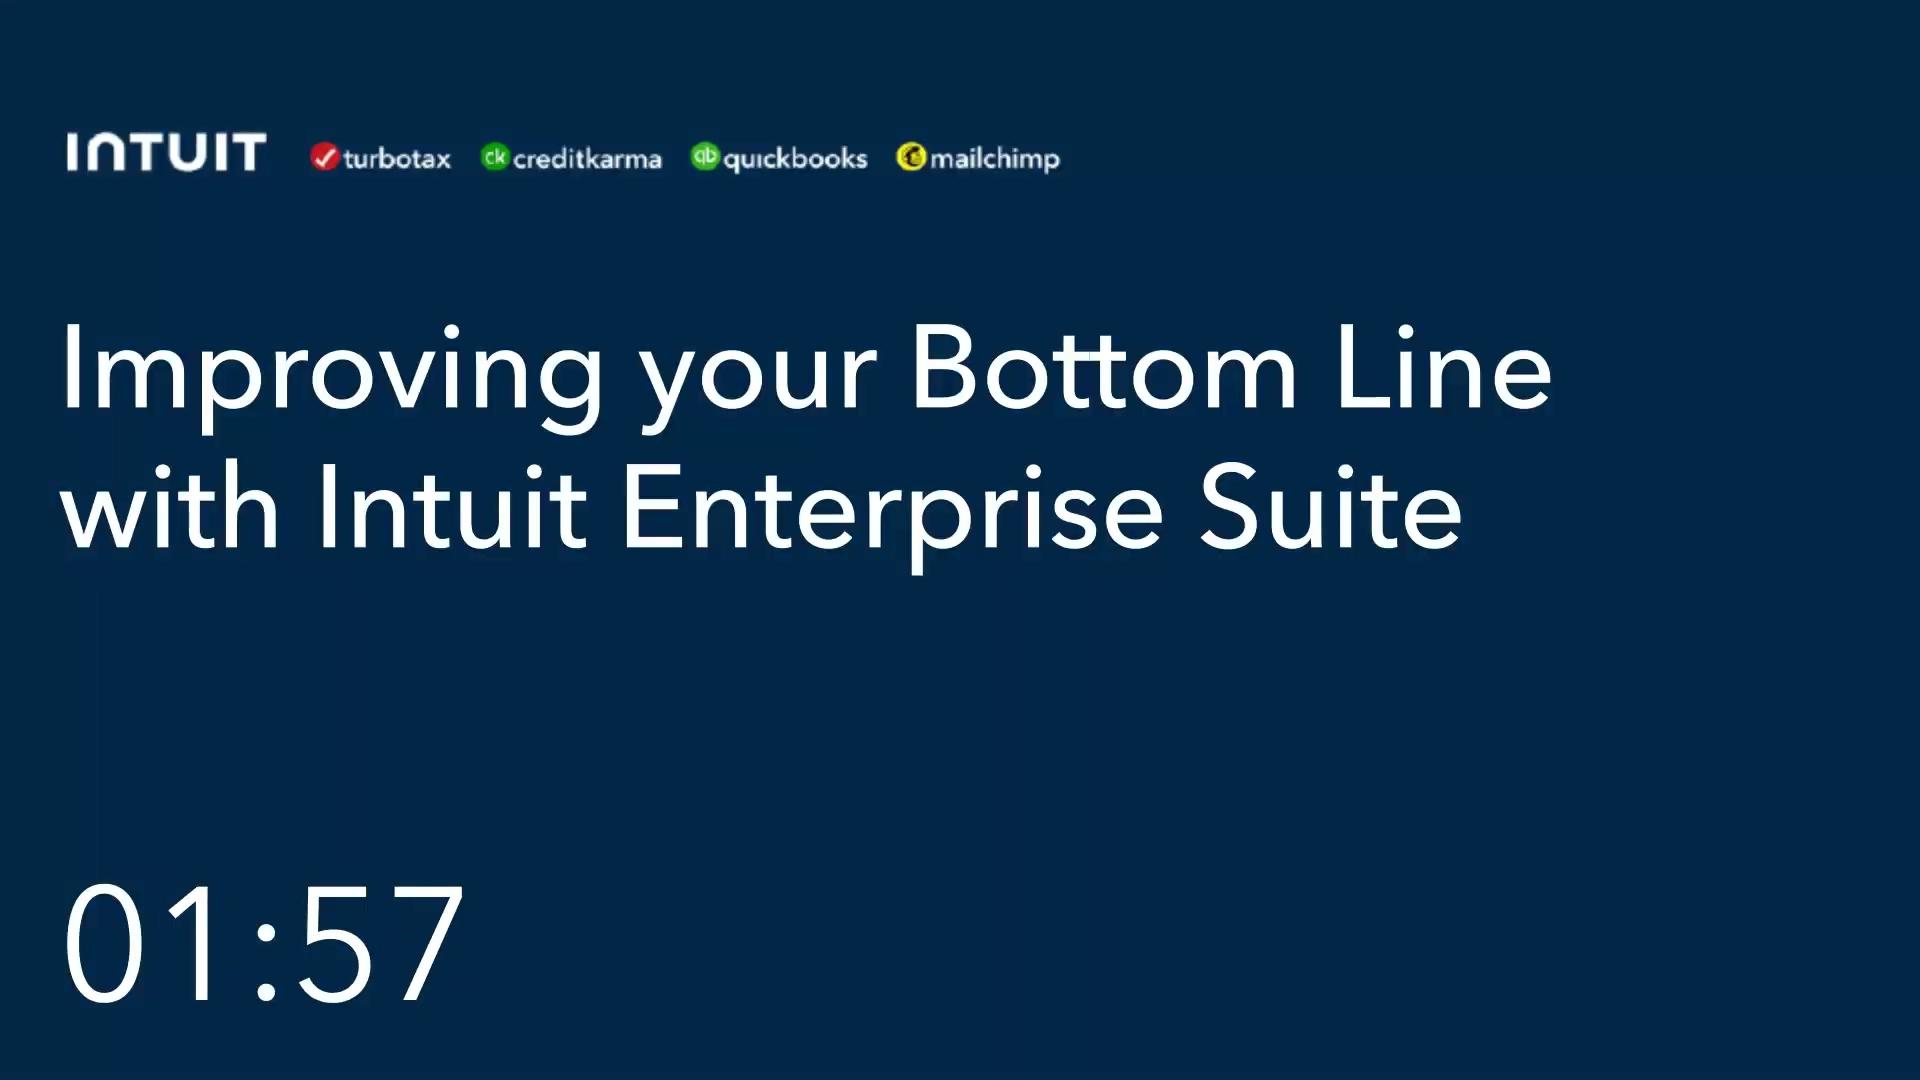
CUSTOMER-FACING WEBINAR
Turn third-party validation into a lead-generation moment.
RESULTS
Credibility translated into unusually strong engagement on several high-intent surfaces.
Lead rate was 5× the IES blog average and ranked third-highest among IES blog URLs with 1K+ traffic.
The content generated 65 unique Salesforce leads and 27 legitimate MQLs.
The full report achieved a 35.8% open rate when shared with customers.
Versus a 3% baseline on evergreen content, though CTA differences make this directional rather than apples-to-apples.
ACTIVATION EXAMPLES
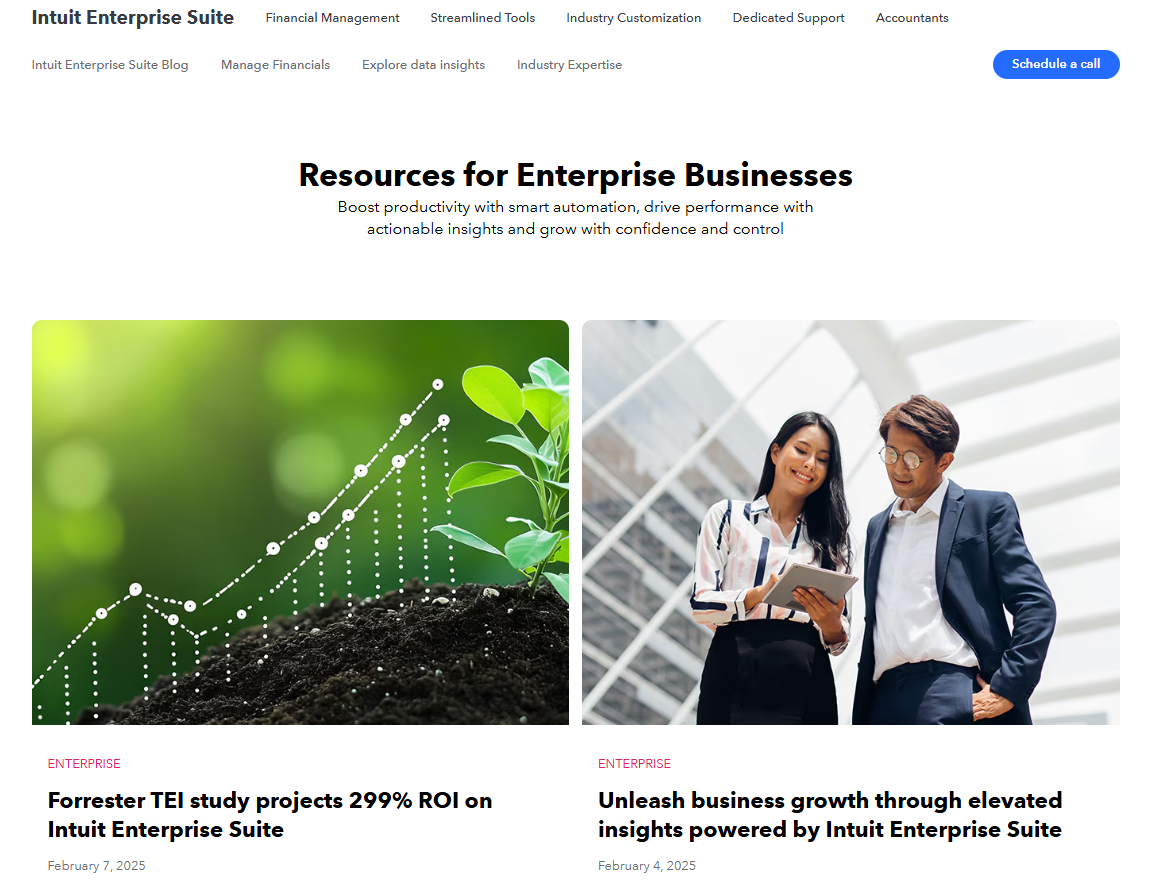
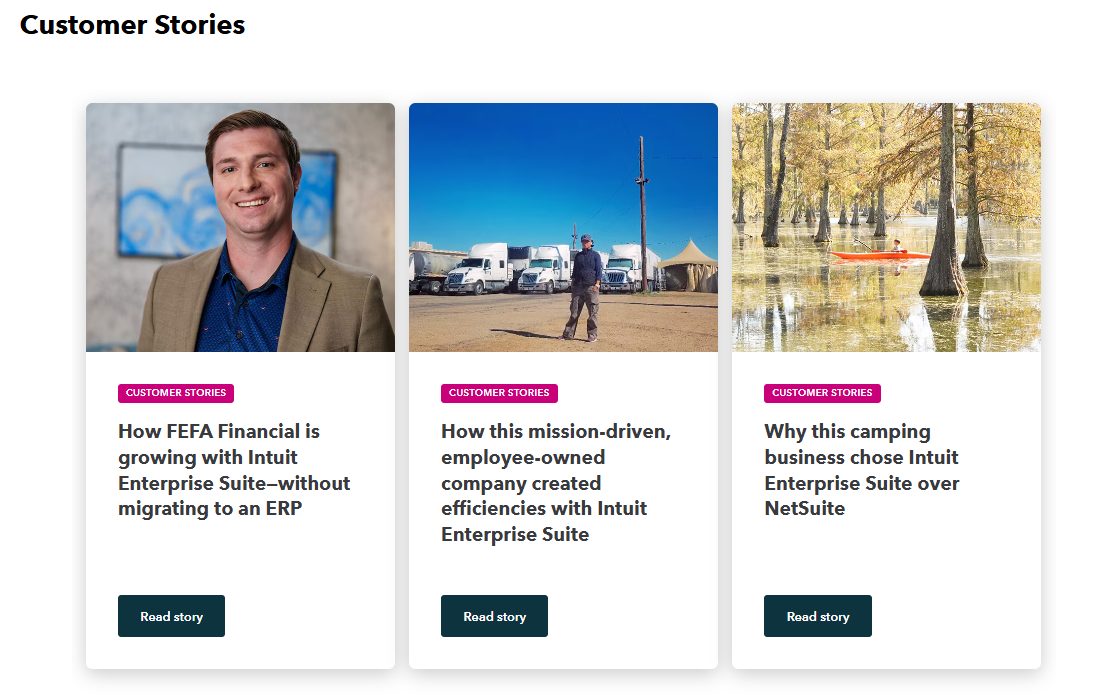
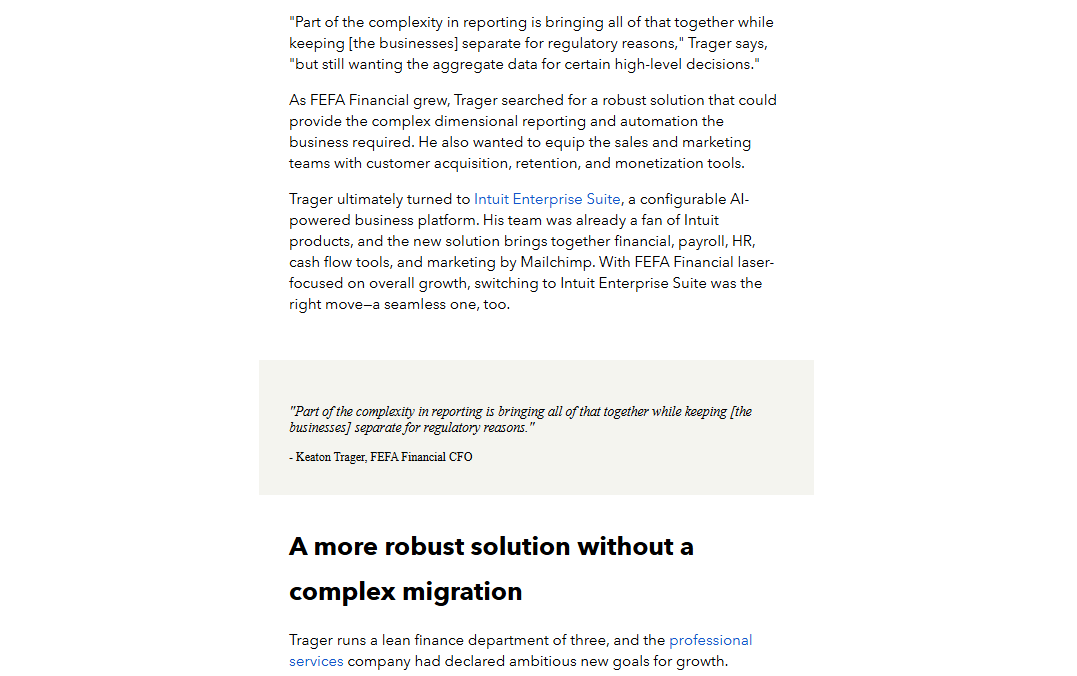
One proof system, multiple expressions.
WHAT I LEARNED
The strongest proof only matters if the organization can absorb and use it.
Plan for governance early. The study ultimately took about 32 weeks—far longer than Forrester’s 16–20 week benchmark—because stakeholder reviews and claim approvals were complex.
Sales Enablement should be a strategic partner from the start. Late involvement made it harder to integrate new tools into existing seller workflows.
Simple proof travels farther than complex tools. The study and claims were easier for sellers to share than the ROI calculators, reinforcing the need to design around actual selling behavior.
Campaign orchestration matters. A unified Sales/Marketing rollout calendar would have reduced overlap with other launches and improved adoption.
NEXT CASE STUDY